Elasticsearch + Fluentd + Kibana Setup (EFK) with Docker
In this article, we will see how to collect Docker logs to EFK (Elasticsearch + Fluentd + Kibana) stack. The example uses Docker Compose for setting up multiple containers.
But before that let us understand that what is Elasticsearch, Fluentd, and kibana.
1. Elasticsearch :- Elasticsearch is a search engine based on the Lucene library. It provides a distributed, multitenant-capable full-text search engine with an HTTP web interface and schema-free JSON documents.
2. Kibana:- Kibana is an open source data visualization dashboard for Elasticsearch. It provides visualization capabilities on top of the content indexed on an Elasticsearch cluster. Users can create bar, line and scatter plots, or pie charts and maps on top of large volumes of data
3. Fluentd:- Fluentd is a cross platform open-source data collection software project originally developed at Treasure Data. It is written primarily in the Ruby programming language.
How to setup EFK stack Step by Step :-
STEP 1:- First of all create a docker-compose.yaml file for EFK stack. In this demo here we are using Opendistro docker images for security , but you can use official image.
version: "3"

services:
  elasticsearch:
    image: amazon/opendistro-for-elasticsearch:1.3.0
    container_name: elasticsearch
    restart: always
    environment:
      - cluster.name=elasticsearch
      - node.name=elasticsearch
      - discovery.seed_hosts=elasticsearch
      - cluster.initial_master_nodes=elasticsearch
      - bootstrap.memory_lock=true # along with the memlock settings below, disables swapping
      - "ES_JAVA_OPTS=-Xms512m -Xmx512m" # minimum and maximum Java heap size, recommend setting both to 50% of system RAM
      - opendistro_security.ssl.http.enabled=false
    ulimits:
      memlock:
        soft: -1
        hard: -1
      nofile:
        soft: 262144 # maximum number of open files for the Elasticsearch user, set to at least 65536 on modern systems
        hard: 262144
    volumes:
      - elasticsearch:/usr/share/elasticsearch/data
    ports:
      - 9200:9200
      - 9600:9600 # required for Performance Analyzer
    networks:
      - traefik-net
  kibana:
    image: yashlogic/amazon-opendistro-for-elasticsearch-kibana-logtrail:1.3.0
    container_name: kibana
    restart: always
    ports:
      - 5601:5601
    expose:
      - "5601"
    environment:
      ELASTICSEARCH_URL: http://elasticsearch:9200
      ELASTICSEARCH_HOSTS: http://elasticsearch:9200
    networks:
      - traefik-net
  fluentd:
    build: ./fluentd
    volumes:
      - ./fluentd/conf:/fluentd/etc
    links:
      - "elasticsearch"
    restart: always
    container_name: fluentd
    ports:
      - "24224:24224"
      - "24224:24224/udp"
    networks:
      - traefik-net

volumes:
  elasticsearch:

networks:
  traefik-net:
STEP 2:- Then create a folder name called fluentd and in that folder create
Dockerfile . it looks like /fluend/Dockerfile
# fluentd/Dockerfile
FROM fluent/fluentd:v1.6-debian-1
USER root
RUN ["gem", "install", "fluent-plugin-elasticsearch", "--no-document", "--version", "3.5.2"]
USER fluent
STEP 3:- After that create a folder conf also create a fluent.conf file inside the fluentd directory. it looks like /fluend/conf/fluent.conf
# fluentd/conf/fluent.conf

<source>
  @type forward
  port 24224
  bind 0.0.0.0
</source>
<match *.**>
  @type copy
  <store>
    @type elasticsearch_dynamic
    hosts elasticsearch:9200
    user admin
    password admin
    include_tag_key true
    type_name access_log
    tag_key @log_name
    flush_interval 10s
    include_timestamp true
    index_name ${tag_parts[0]}
  </store>
  <store>
    @type stdout
  </store>
  <buffer tag>
    @type memory # or file
    flush_thread_count 4
  </buffer>
</match>
In this config you can remove user and password if you are not using opendistro images and change your hosts . Now run the docker compose file by this command.
docker-compose up -d
STEP 4:- Finally EFK stack is ready now lauch your application and send the logs into Elasticsearch. Here i am using nginx and attached the logging tag
version: "3"

services:
  nginx:
    image: nginx
    container_name: nginx
    restart: always
    ports:
      - 80:80
    logging:
      driver: "fluentd"
      options:
        fluentd-address: 192.45.34.34:24224
        tag: fluent
In this config use your fluentd-address and give the tag name for kibana index pattern.
STEP 5:- Now Confirm Logs from Kibana Dashboard so go to http://localhost:5601/ with your browser. Then, you need to set up the index name pattern for Kibana. Please specify fluent* to Index name or pattern and press Create button
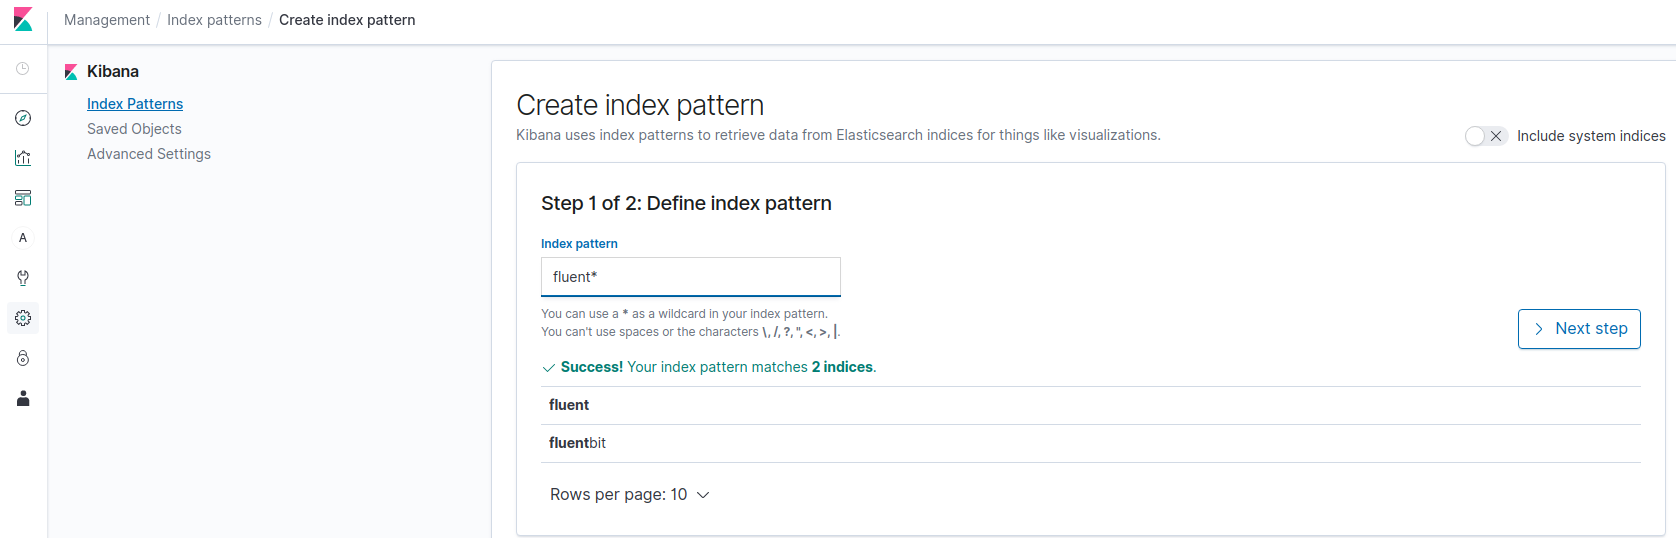
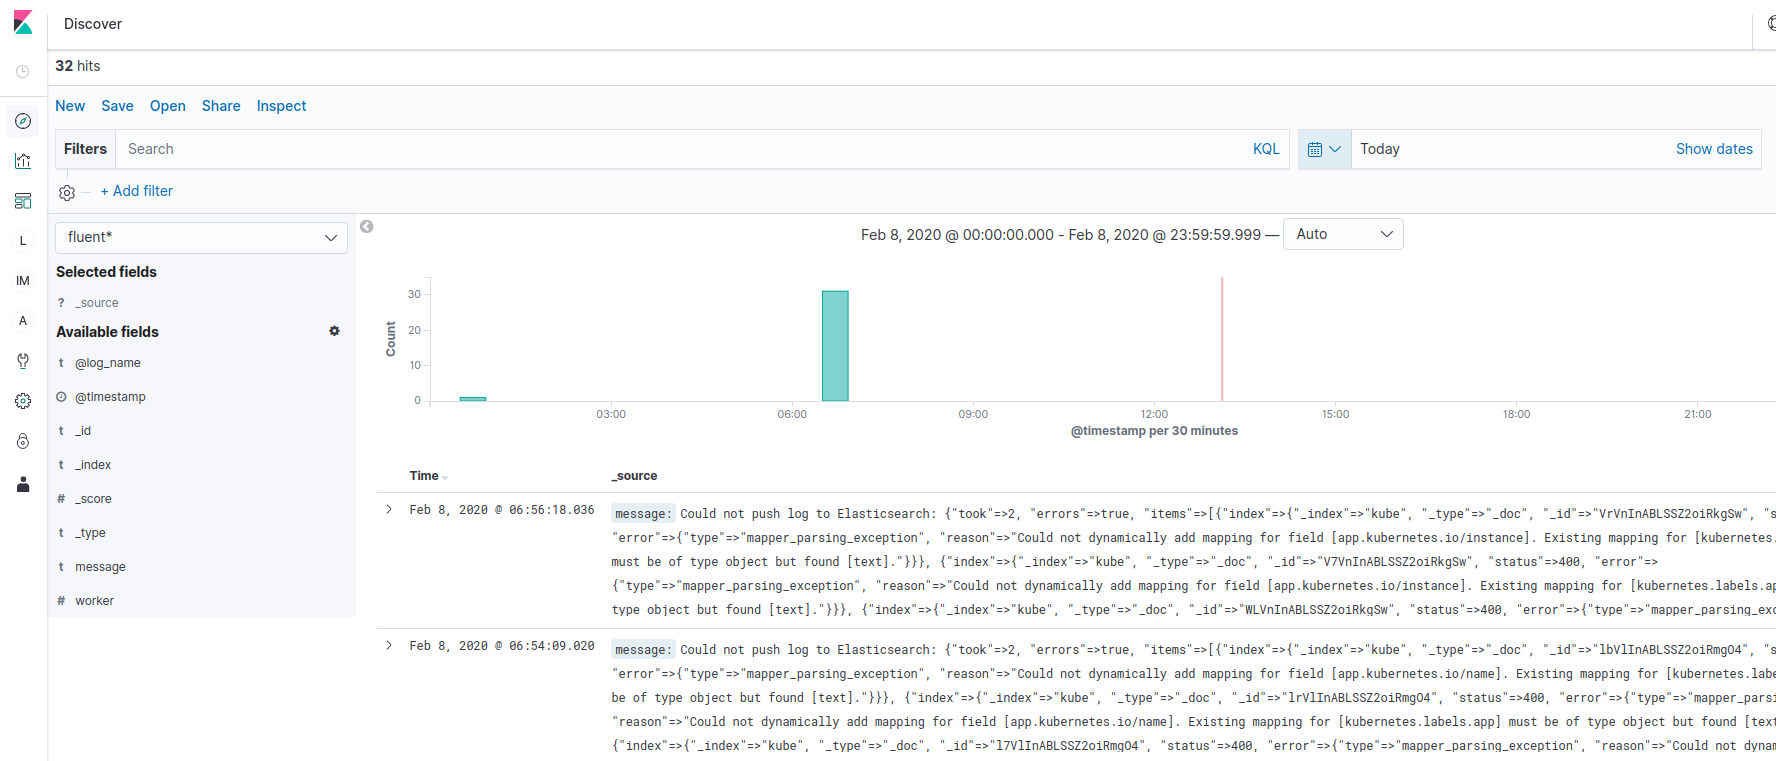
Here you can see that your index pattern created and now you can see your application logs by going to discover section
Reference links:- https://docs.fluentd.org/container-deployment/docker-compose